
Brexit plot
## Rows: 632
## Columns: 11
## $ Seat        <chr> "Aldershot", "Aldridge-Brownhills", "Altrincham and Sale W…
## $ con_2015    <dbl> 50.6, 52.0, 53.0, 44.0, 60.8, 22.4, 52.5, 22.1, 50.7, 53.0…
## $ lab_2015    <dbl> 18.3, 22.4, 26.7, 34.8, 11.2, 41.0, 18.4, 49.8, 15.1, 21.3…
## $ ld_2015     <dbl> 8.82, 3.37, 8.38, 2.98, 7.19, 14.83, 5.98, 2.42, 10.62, 5.…
## $ ukip_2015   <dbl> 17.87, 19.62, 8.01, 15.89, 14.44, 21.41, 18.82, 21.76, 19.…
## $ leave_share <dbl> 57.9, 67.8, 38.6, 65.3, 49.7, 70.5, 59.9, 61.8, 51.8, 50.3…
## $ born_in_uk  <dbl> 83.1, 96.1, 90.5, 97.3, 93.3, 97.0, 90.5, 90.7, 87.0, 88.8…
## $ male        <dbl> 49.9, 48.9, 48.9, 49.2, 48.0, 49.2, 48.5, 49.2, 49.5, 49.5…
## $ unemployed  <dbl> 3.64, 4.55, 3.04, 4.26, 2.47, 4.74, 3.69, 5.11, 3.39, 2.93…
## $ degree      <dbl> 13.87, 9.97, 28.60, 9.34, 18.78, 6.09, 13.12, 7.90, 17.80,…
## $ age_18to24 <dbl> 9.41, 7.33, 6.44, 7.75, 5.73, 8.21, 7.82, 8.94, 7.56, 7.61…| Name | brexit_results |
| Number of rows | 632 |
| Number of columns | 11 |
| _______________________ | |
| Column type frequency: | |
| character | 1 |
| numeric | 10 |
| ________________________ | |
| Group variables | None |
Variable type: character
| skim_variable | n_missing | complete_rate | min | max | empty | n_unique | whitespace |
|---|---|---|---|---|---|---|---|
| Seat | 0 | 1 | 4 | 43 | 0 | 632 | 0 |
Variable type: numeric
| skim_variable | n_missing | complete_rate | mean | sd | p0 | p25 | p50 | p75 | p100 | hist |
|---|---|---|---|---|---|---|---|---|---|---|
| con_2015 | 0 | 1.00 | 36.60 | 16.22 | 0.00 | 22.09 | 40.85 | 50.84 | 65.88 | ▂▅▃▇▅ |
| lab_2015 | 0 | 1.00 | 32.30 | 16.54 | 0.00 | 17.67 | 31.20 | 44.37 | 81.30 | ▆▇▇▅▁ |
| ld_2015 | 0 | 1.00 | 7.81 | 8.36 | 0.00 | 2.97 | 4.58 | 8.57 | 51.49 | ▇▁▁▁▁ |
| ukip_2015 | 0 | 1.00 | 13.10 | 6.47 | 0.00 | 9.19 | 13.73 | 17.11 | 44.43 | ▃▇▃▁▁ |
| leave_share | 0 | 1.00 | 52.06 | 11.44 | 20.48 | 45.33 | 53.69 | 60.15 | 75.65 | ▂▂▆▇▂ |
| born_in_uk | 0 | 1.00 | 88.15 | 11.29 | 40.73 | 86.42 | 92.48 | 95.42 | 98.02 | ▁▁▁▂▇ |
| male | 0 | 1.00 | 49.07 | 0.80 | 46.86 | 48.61 | 49.02 | 49.43 | 53.05 | ▁▇▃▁▁ |
| unemployed | 0 | 1.00 | 4.37 | 1.42 | 1.84 | 3.23 | 4.19 | 5.21 | 9.53 | ▆▇▅▂▁ |
| degree | 59 | 0.91 | 16.71 | 8.36 | 5.10 | 10.79 | 14.69 | 19.59 | 51.10 | ▇▆▂▁▁ |
| age_18to24 | 0 | 1.00 | 9.29 | 3.59 | 5.73 | 7.30 | 8.28 | 9.60 | 32.68 | ▇▁▁▁▁ |
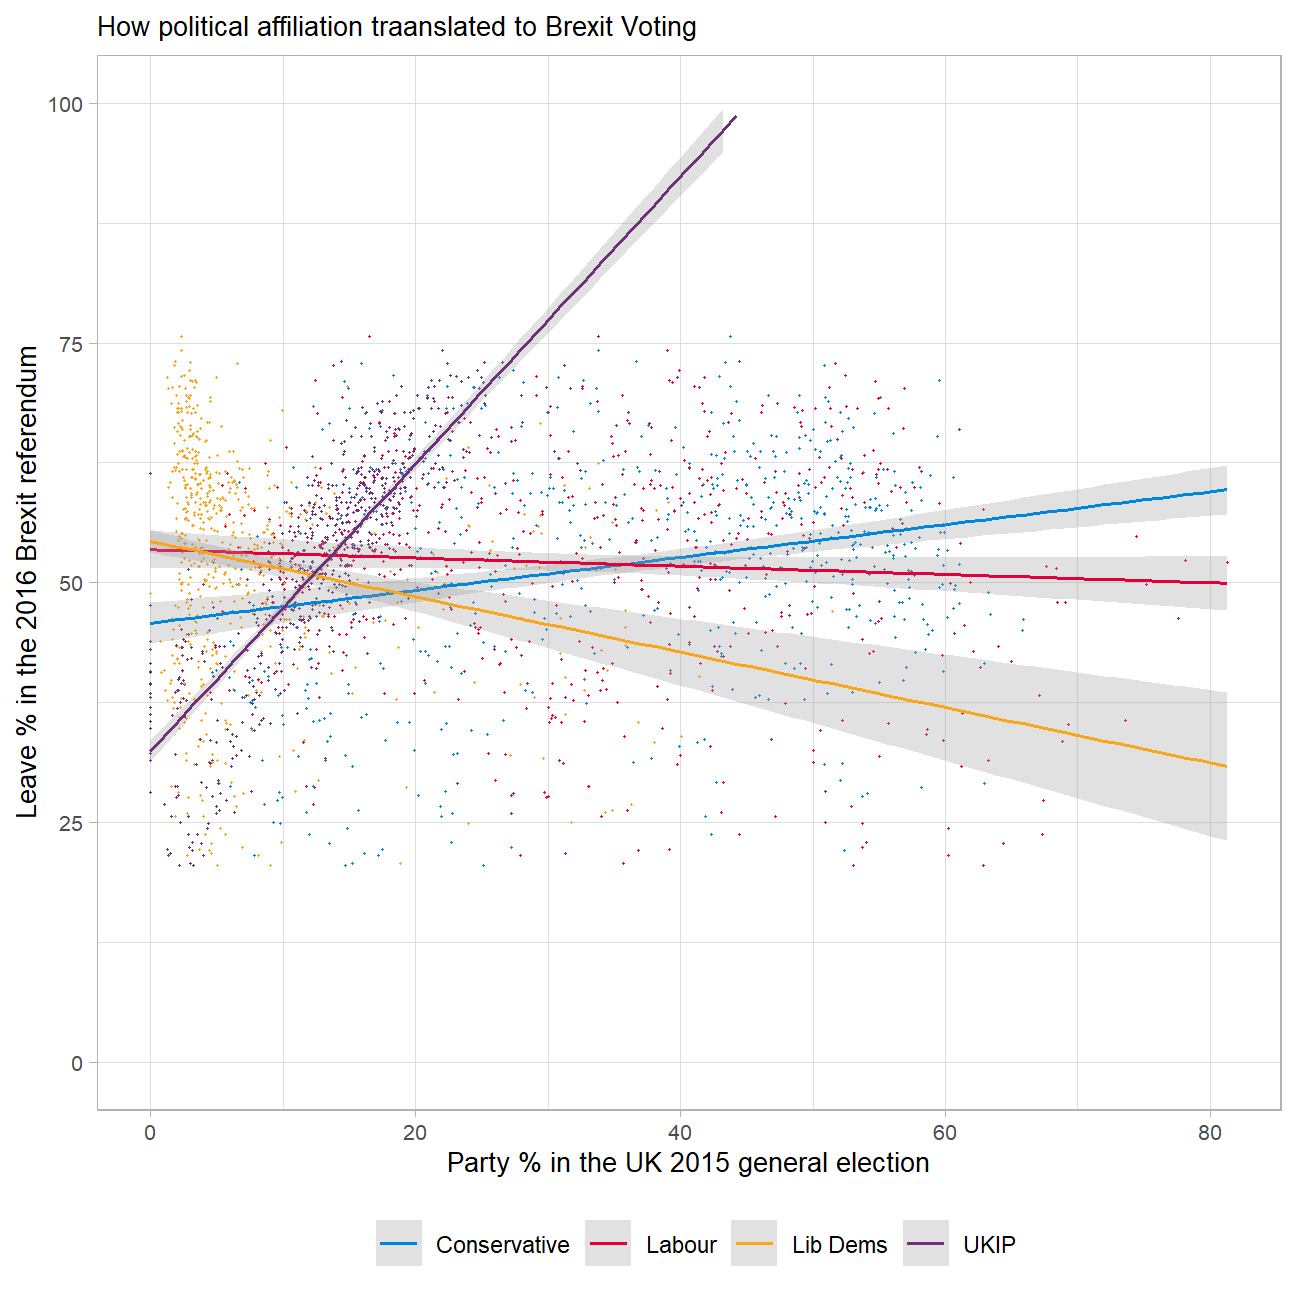
Analysis:
The plot shows several interesting patterns. Generalizing conclusions should made cautiously which is why especially the relationship of the parliament constituencies’ share of votes for the labour and/or conservative party and the corresponding leave share votes should not be over interpreted. However, the stronger trends for the Liberal Democrats as well as the Independent Party may show some interesting tendencies. While parliament constituencies in which the vote share for the Liberal Democrats was relatively low showed above 50% vote shares for Brexit, this vote share quickly depletes as the share of Liberal Democrats affiliation increases. An inverse relation with stronger magnitude is to be observed for the UKIP. In underrepresented parliament constituencies the vote share to leave the EU was relatively low but strongly increases as the affiliation to the UKIP grows. At around 20% representation of the UKIP in the parliament constituencies the vote shares were up to 75%. This finding should not come as a surprise, as the main campaign positions of the UKIP was to be independent of the EU whereas the Liberal Democrats campaigned to stay.